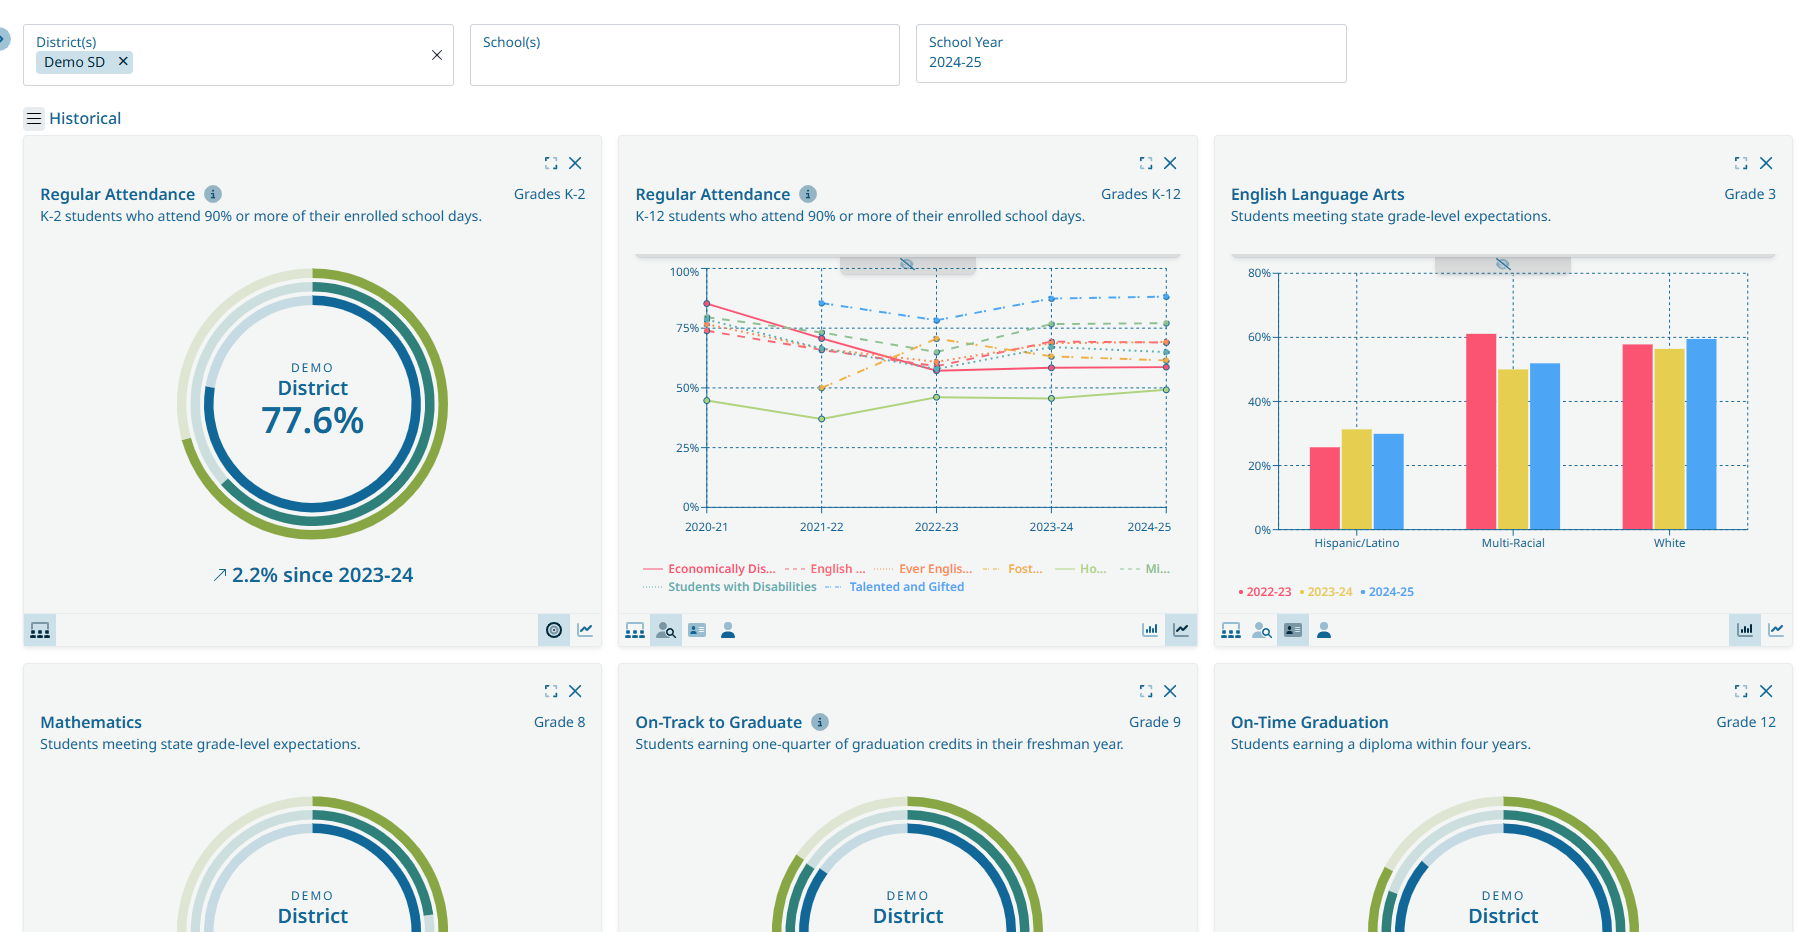
Created to assist districts with gathering information for your Student Investment Account Plan (SIA). Our new Success Dashboard provides the historical data for your district that you need to help you write your plan.
-
Regular Attendance Grade K-2
-
Regular Attendance Grades K-12
-
English Language Arts Grade 3
-
Mathematics Grade 8
-
On-Track to Graduate Grade 9
-
On-Time Graduation Grade 12
-
Five-Year Completion Grade 12+
-
Dropouts Grades 7-12
The Success Dashboard features graphic displays of student information that show your progress across years for your district compared to state averages. The information is displayed for all students, disaggregated by student demographics, and can be viewed in different formats by selecting the icon under the metric. The graphs can be printed in portrait or landscape.

|
All Students |

|
Focal Groups |

|
Race/Ethnicity |

|
Radial Chart |

|
Line Chart |

|
Column Chart |
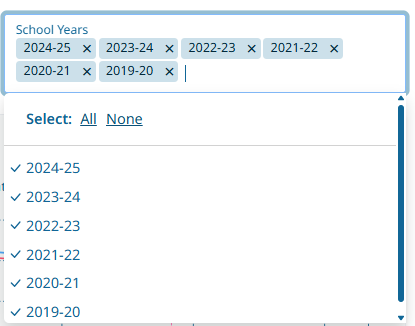
Trend data projecting out for the next 5 years is now available. Additional years of data will be updated as it becomes available from ODE.
All data comes from the state media files. The reading is actually ELA composite scores since that’s what the state is using for SIA. The ELA percentages come from the State Assessment files. Below is a link for all of the files. The only data we are pulling from the public report card files (under School & District Profiles and Reports) is the Freshman on Track.https://www.oregon.gov/ode/reports-and-data/Pages/default.aspx
-
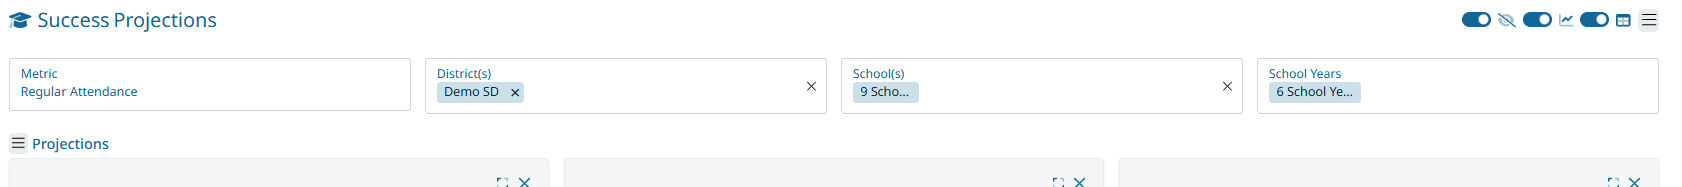
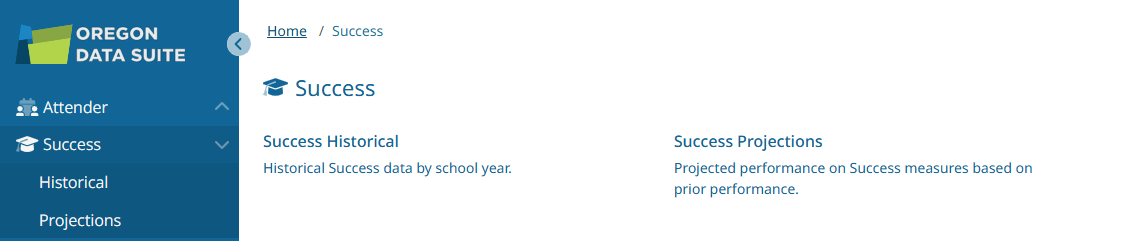
The Success Dashboard is split into two pages: Historical & Projections.
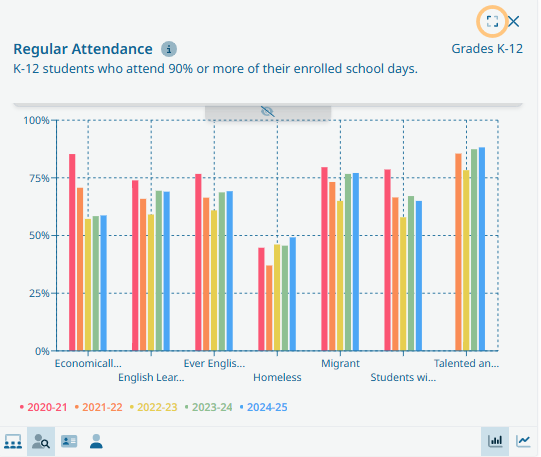
The Success Dashboard pages will be easy to navigate and view only the metrics you want to see. Users can have metrics hidden by clicking the hide button (X) in the top right corner. The view options will remain the same: radial chart view of all students, line/column charts for race/ethnicity, and line/column charts for focal groups.
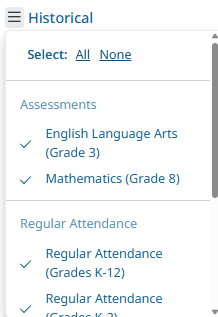
The visibility of metrics can be managed in the Metric Group menu which can be viewed using the button with the vertical ellipsis icon to the left of the Metric Group (Historical) title. The checkmarks indicate which metrics will be shown on the page.
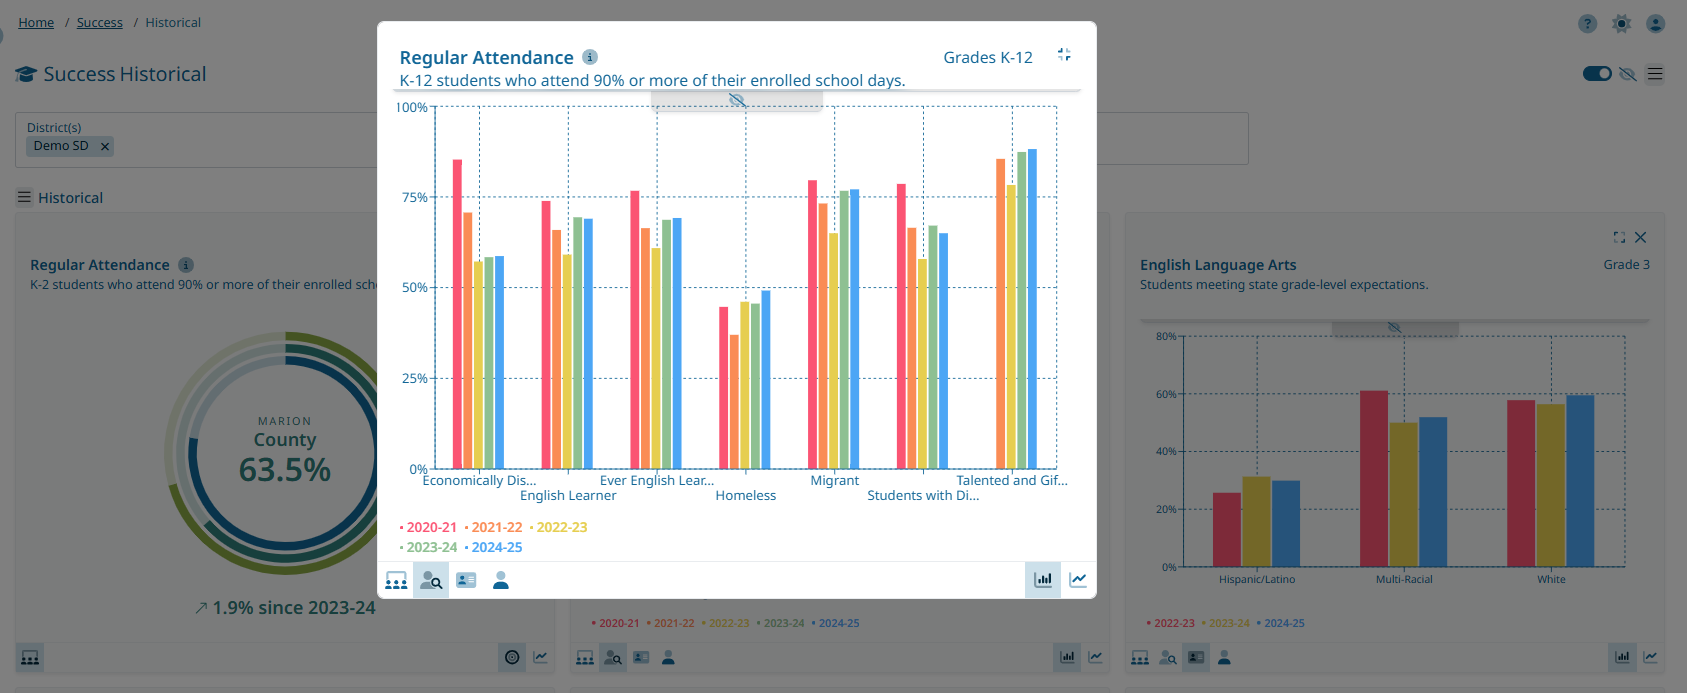
Metrics can be viewed in full-screen mode by clicking the full-screen icon in the right-hand corner next to the (X).
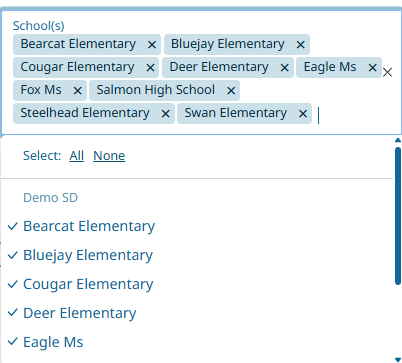
On the Projections page, users can select the schools and school years they want to be included in the Success Projection calculations. This option was in response to districts' requests to exclude any year(s) that were unusual and potentially interfered with the accuracy of the projections.