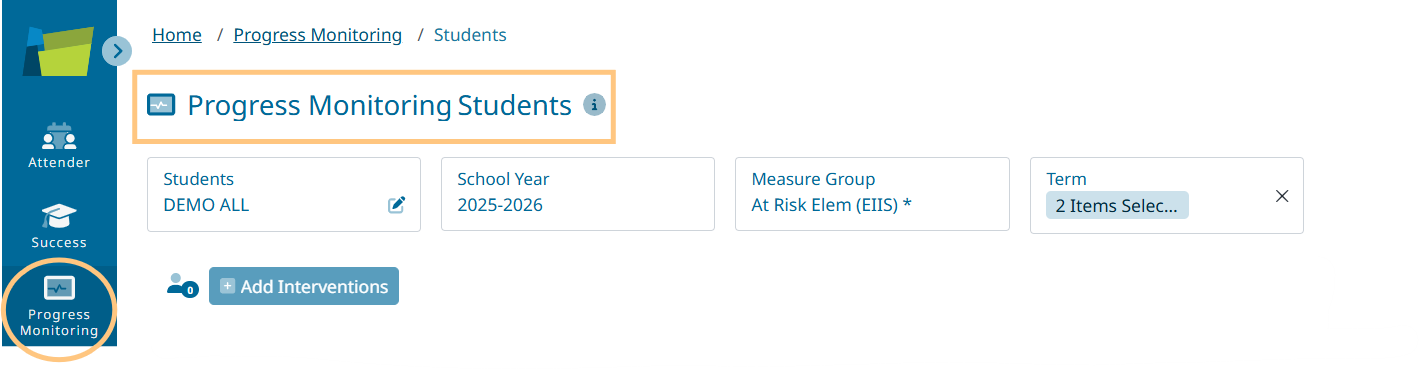
Progress Monitoring Students:
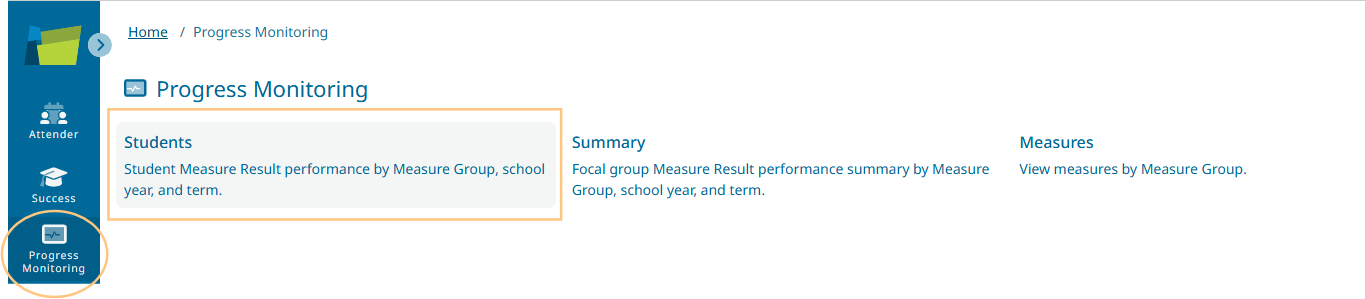
Pathway: Progress Monitoring > Students
-
Navigate the filters across the top of the screen.

|
Students |
School Year |
Measure Group |
Term |
|---|---|---|---|
|
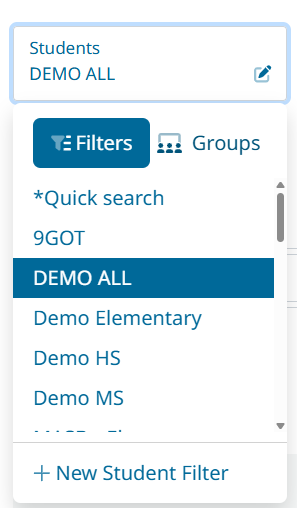
Select your filter to pull in the students you want to review. |
Pull in the specific school-year data for the students you are filtering on. |
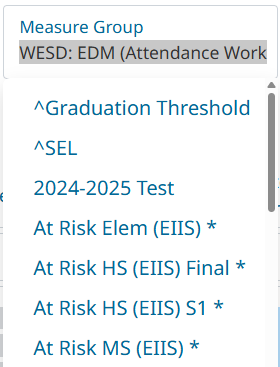
Select the Measure Group |
By default, the term will pull the latest term. |
|
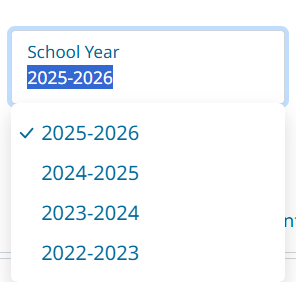
You may want to view this year’s students and how they finished the prior year, so you can adjust the school year. |
|
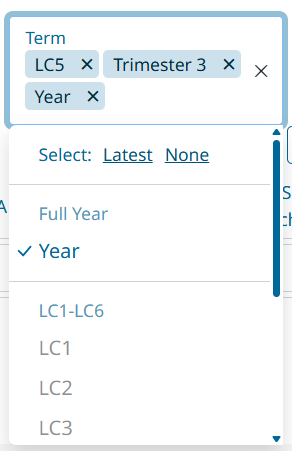
You can adjust the term to view prior data sets for the year. |
Exploring the page-
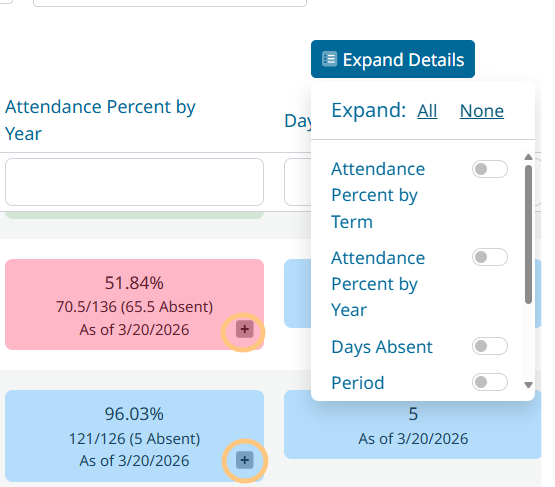
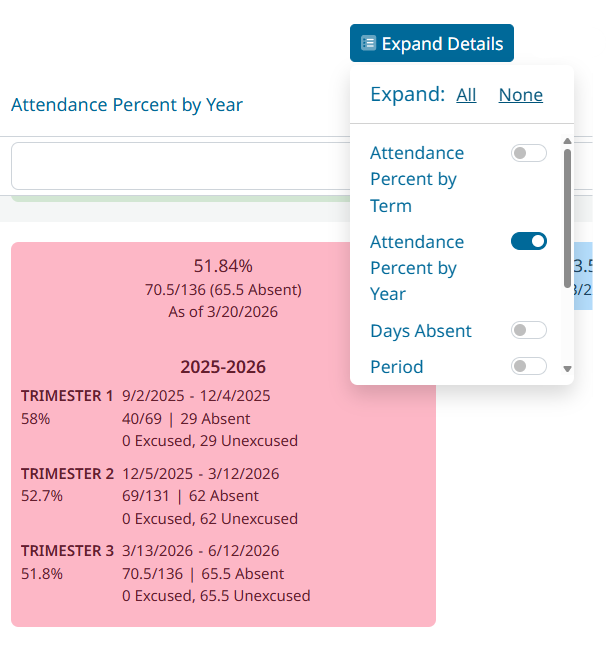
Expanded Details-
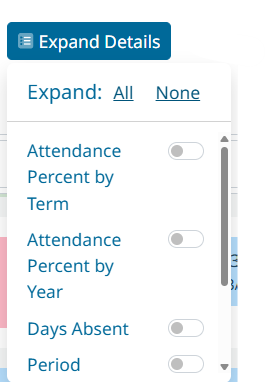
|
Any time there is a + icon, you can expand the details for that data point. |
You can either adjust within the Expand Details or click the + icon. |
|---|---|
|
|
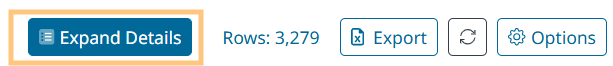
Rows-
-
The Rows: is the count of how many students are being pulled into the Progress Monitoring Student Screen.

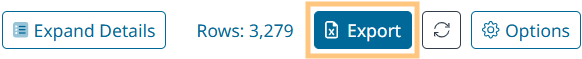
Export-
-
Select the export to pull all data into an Excel document that will appear in your downloads.
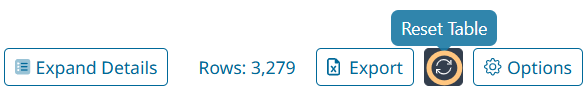
Reset Table-
-
The refresh icon will reset the entire data table.
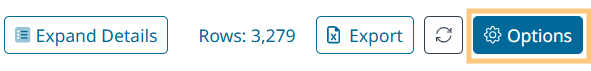
Options-
-
The options tab includes Columns and Sorting-
-
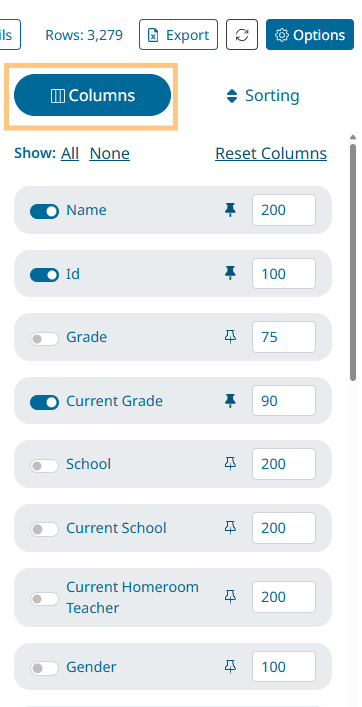
Columns-
-
Sorting-
-
Columns Tab: Toggle the switch next to the name of the column(s) you want to display. (Example: Id, Name, Current Grade, Current School)
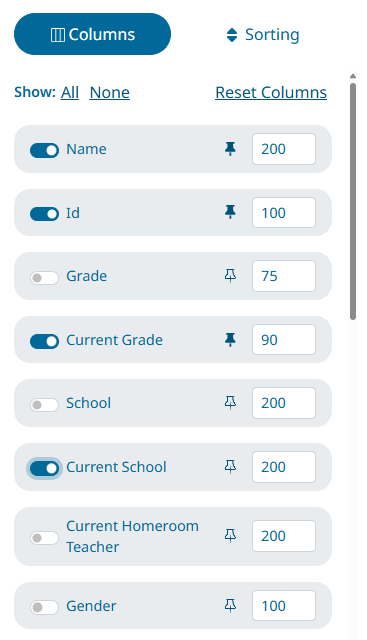
-
Click the pin next to the column(s) name to pin the column(s) in place while viewing
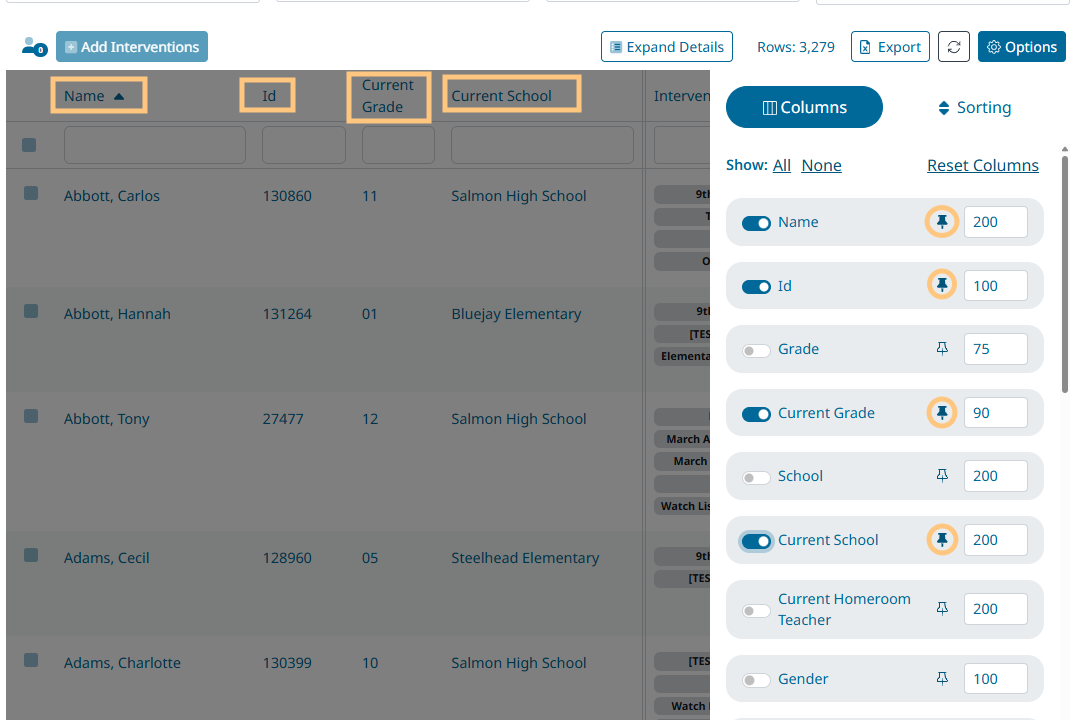
-
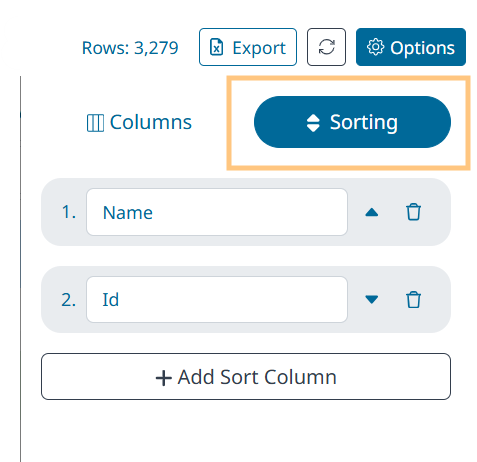
Sorting Tab: Use the dropdown of selected columns to determine the sorting
-
To add another sort column - Click the +Sort Column button
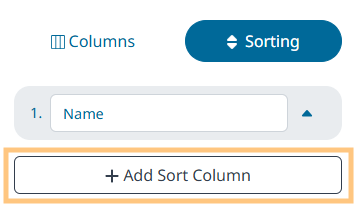
-
Choose the dropdown to pick which of your columns you would like to sort
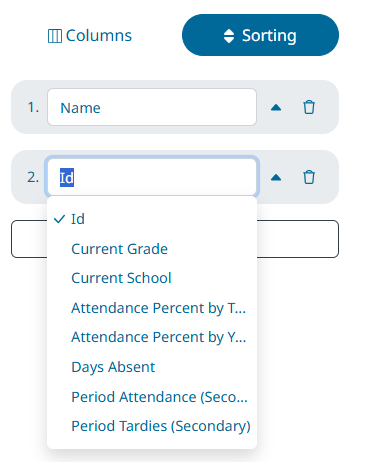
-
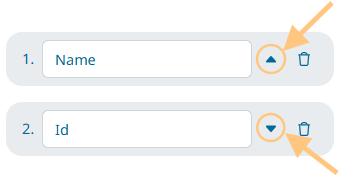
Sort data by ascending or descending order
Viewing Data on the Progress Monitoring Students screen-
Use the empty cells to sort or identify students you want to include in the intervention. (Example Grade & Attendance Percentage) And your row count will adjust based on those filters.
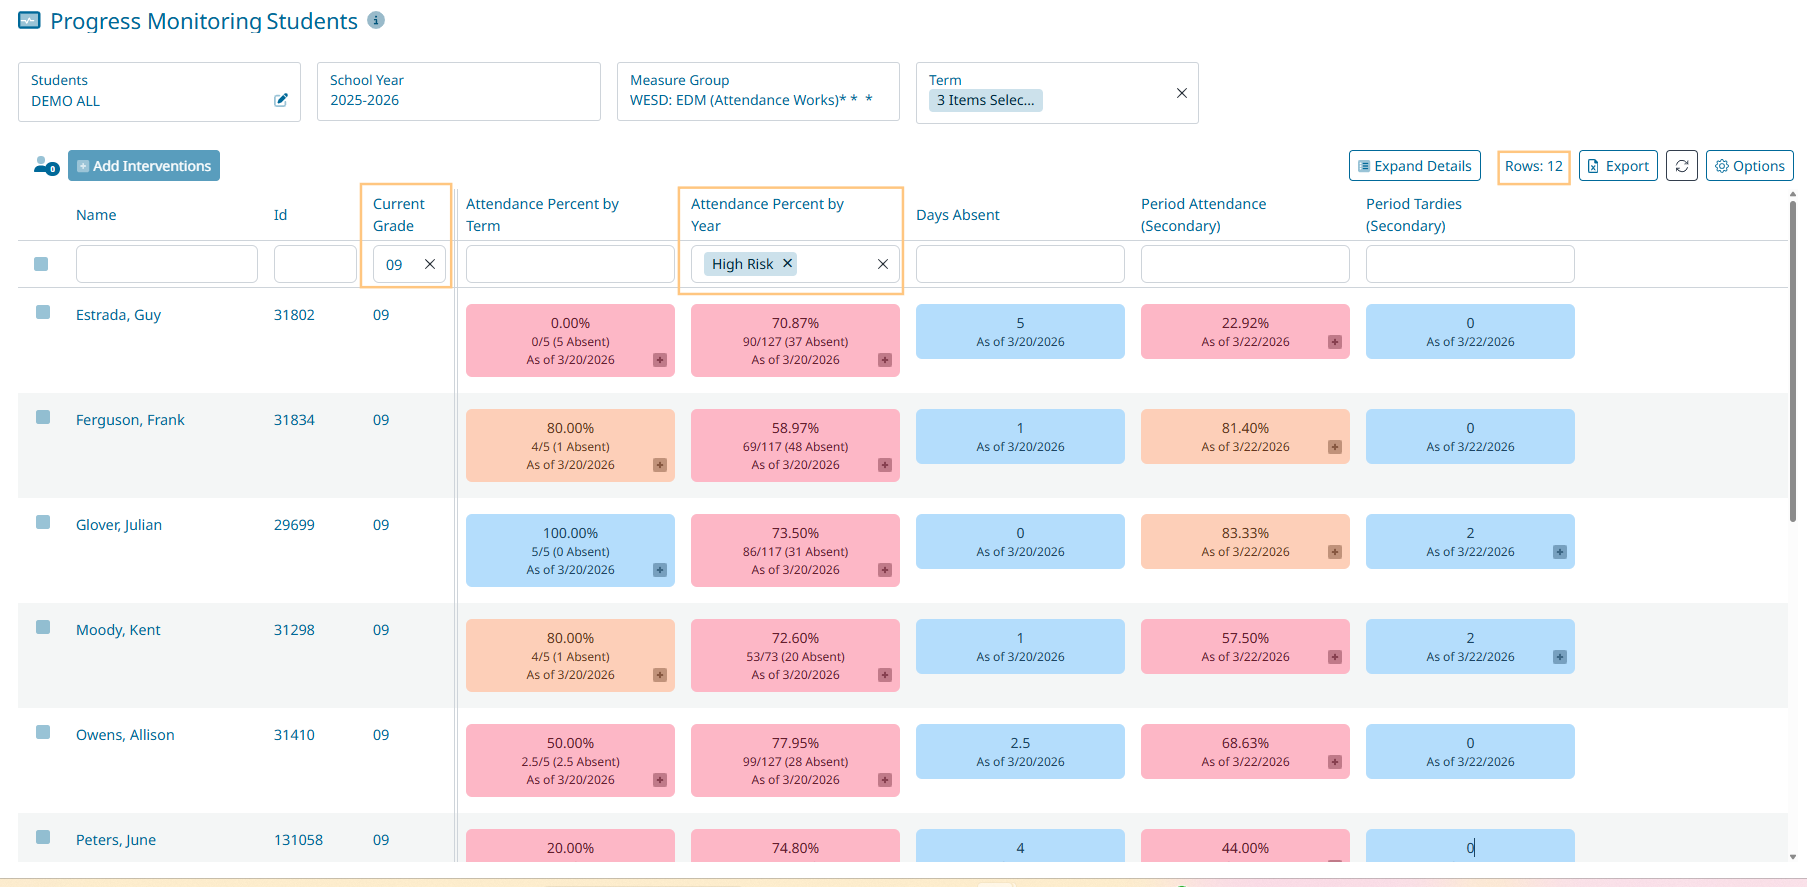
-
Example: Enter Grade and Select Risk Level for Attendance Percent by Year from the Drop Down Menu on columns
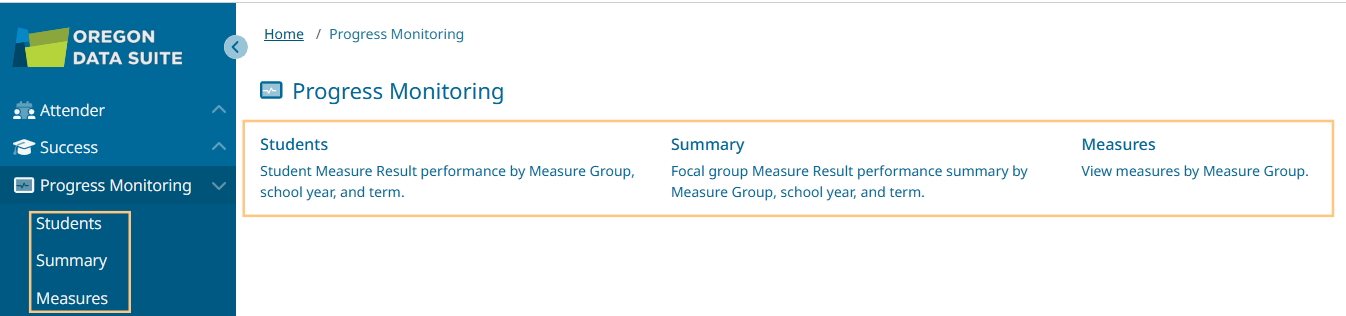
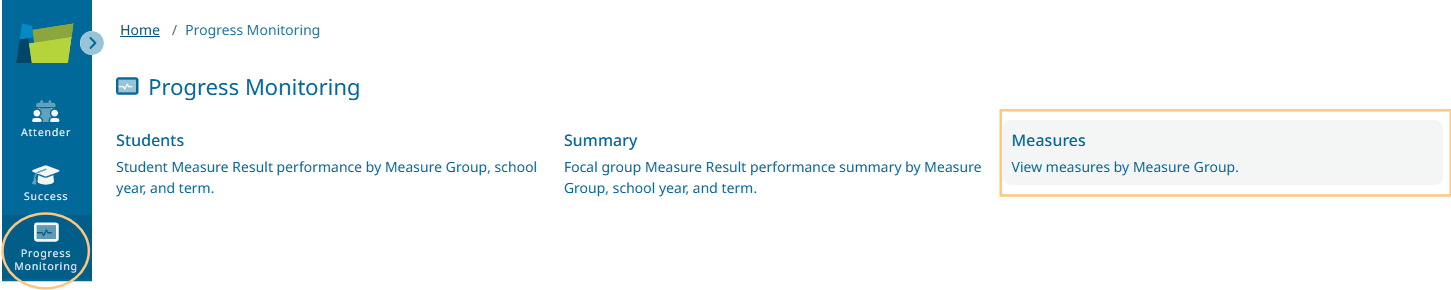
Progress Monitoring Summary:
Pathway: Progress Monitoring > Summary
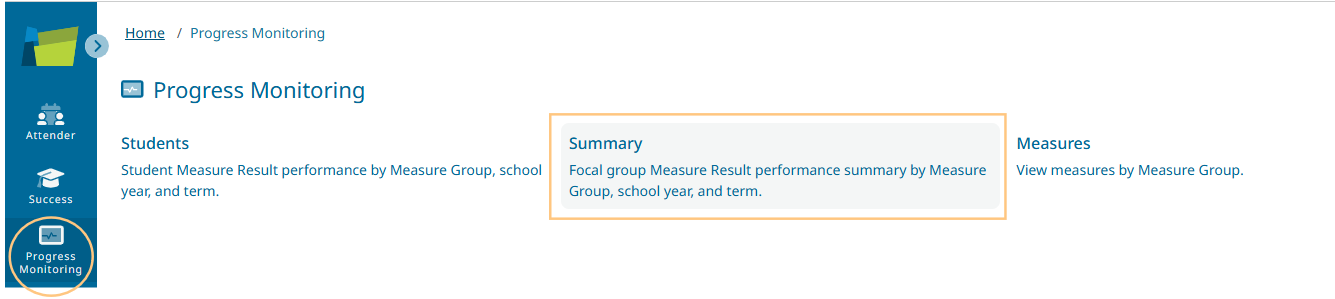
The Summary view allows you to see your data in aggregated views based on demographics.
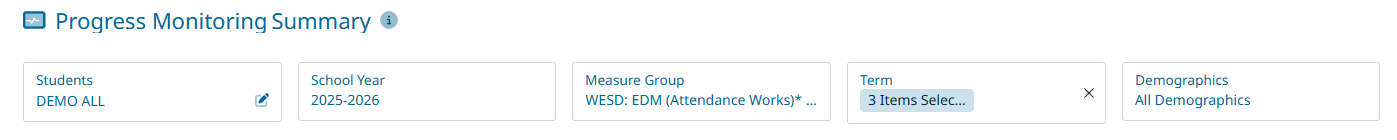
|
Students |
School Year |
Measure Group |
Term |
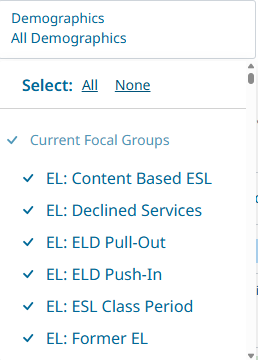
Demographics |
|---|---|---|---|---|
|
Select your filter to pull in the students you want to review. |
Pull in the specific school-year data for the students you are filtering on. |
Select the Measure Group |
By default, the term will pull the latest term. |
By default, all demographics will be selected. |
|
|
You may want to view this year’s students and how they finished the prior year, so you can adjust the school year. |
|
You can adjust the term to view prior data sets for the year. |
|
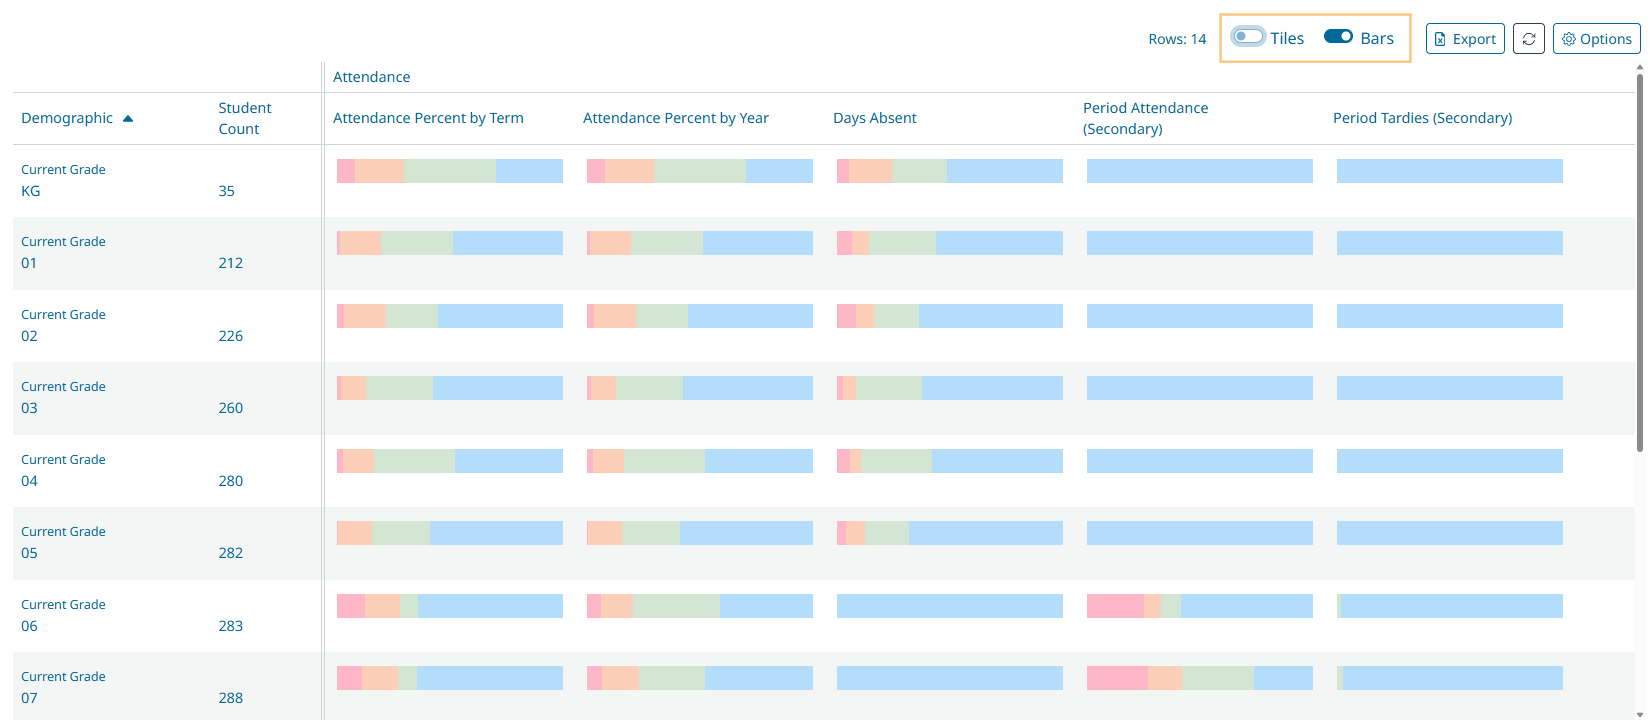
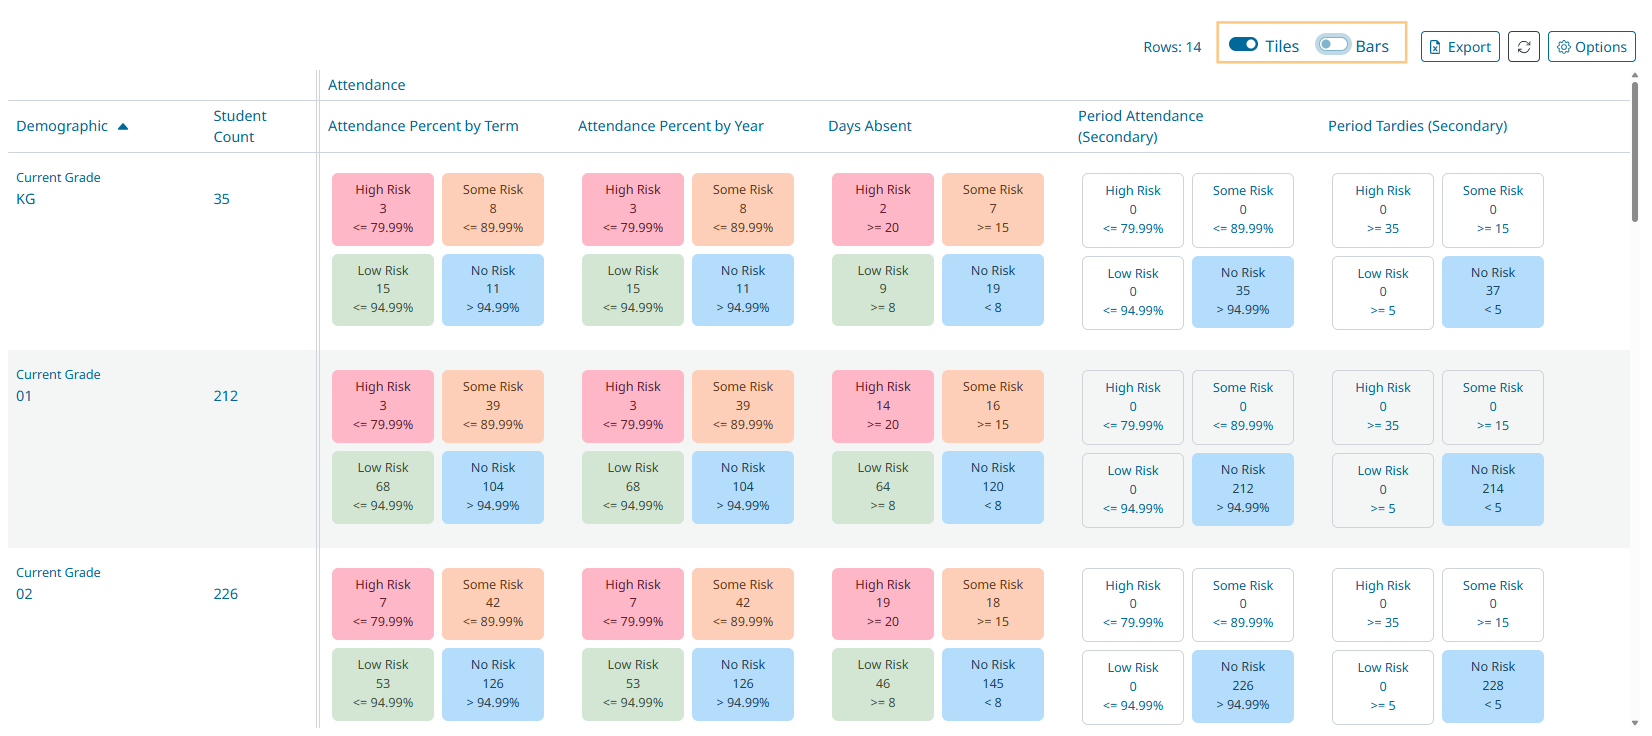
Now you can view by demographic group. In the example below, the current grade level is the demographic selected.
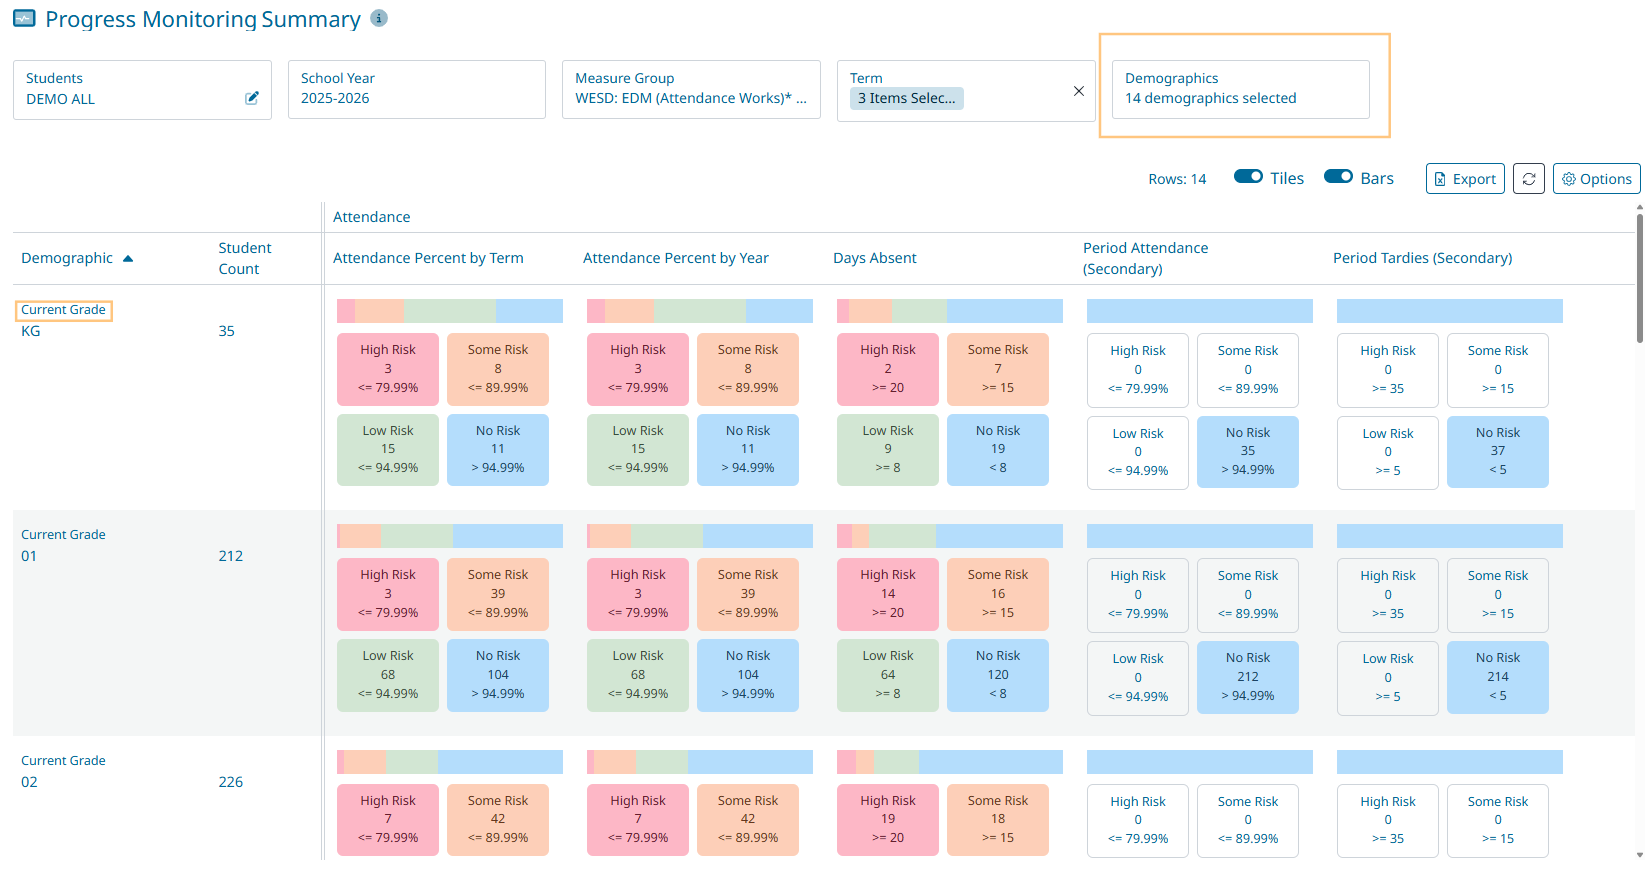
Since there are 14 demographics, there are 14 rows showing, and both the tile view and bar view are toggled on.
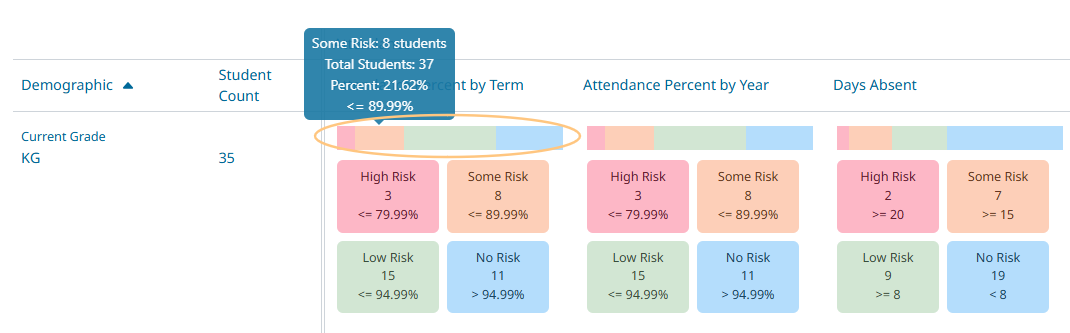
When you hover over any colored area in the tiles or bars, you will get the total students for that risk level- for example, if you hover over the orange bar as seen below: Some Risk: 8 students are <= 89.99% for Attendance Percent by term. You can click on the orange bar or orange tile to get to those 8 students on the Progress Monitoring Student page.
-
Tiles toggled off, Bars toggled on-
-
Tiles toggled on, Bars toggled off-
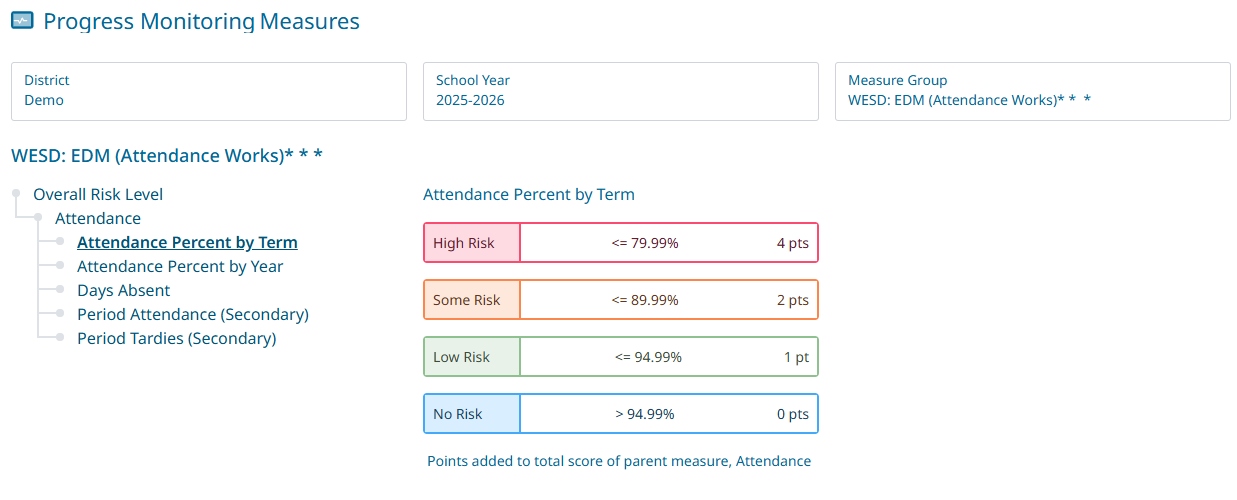
Progress Monitoring Measures:
Pathway: Progress Monitoring> Measures
Select the Measure Group that you want to see what the thresholds are for each of the columns that you can see on the Student and Summary view of Progress Monitoring. (Ex: Measure Group: WESD EDM (Attendance Works)***, Attendance Percent by Term)