The Oregon Data Suite provides the ability for a user to customize the dashboards that they use to analyze data within their school. As a District Administrator, you can now create pages that can’t be changed by users.
To customize your Dashboards:
-
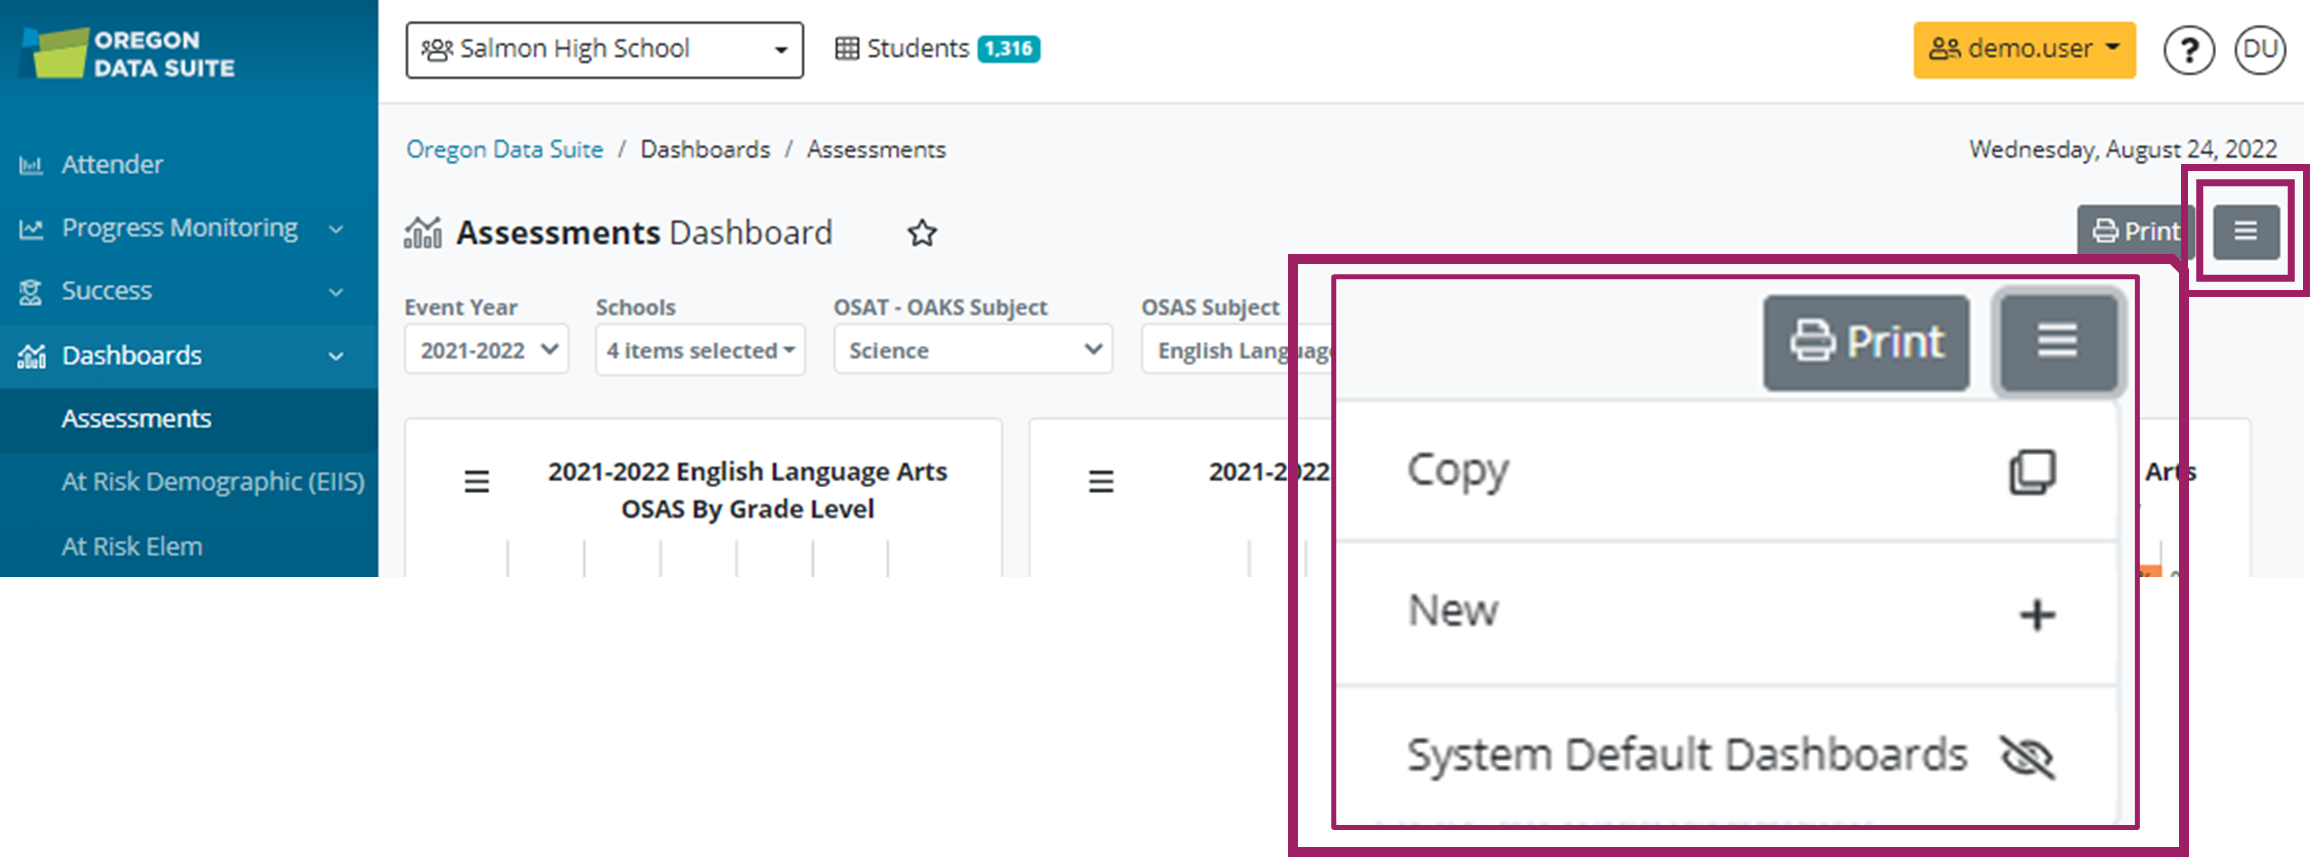
Select the page you want to customize by clicking on it. Your pages are System Default pages that have to be copied before you can customize them. If you copy a page, give it a new unique name. You can also create ‘New’ pages.
Once you’ve created your own page you can edit your page
-
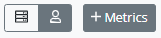
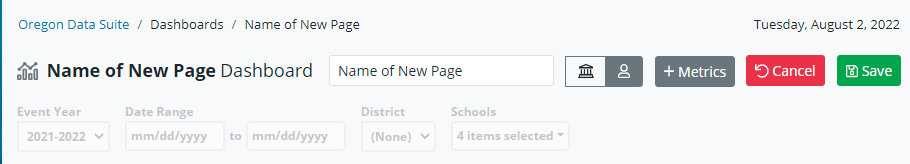
Determine if this will be a ‘District Shared Dashboard’ page or a personal ‘My Dashboard’ page that only you can see. Make sure you click ‘Save’ when you're done or ‘Cancel’ if you decide not to make changes.
-
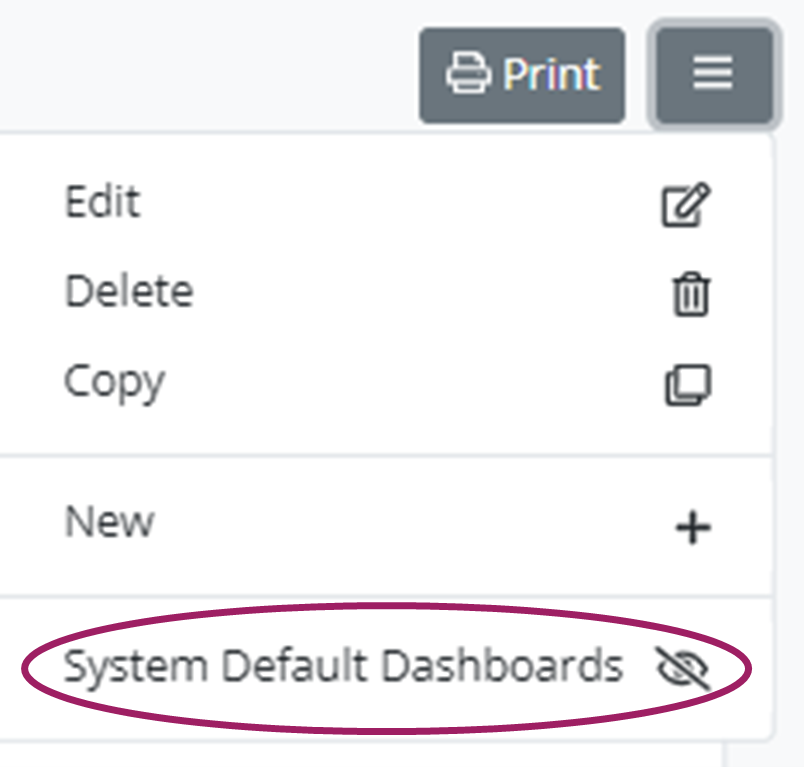
To hide a ‘System Default Dashboards’ page from your users, select the page and click on the Dashboard menu, select ‘System Default Dashboards’, this will allow you to make default pages hidden or visible to users.
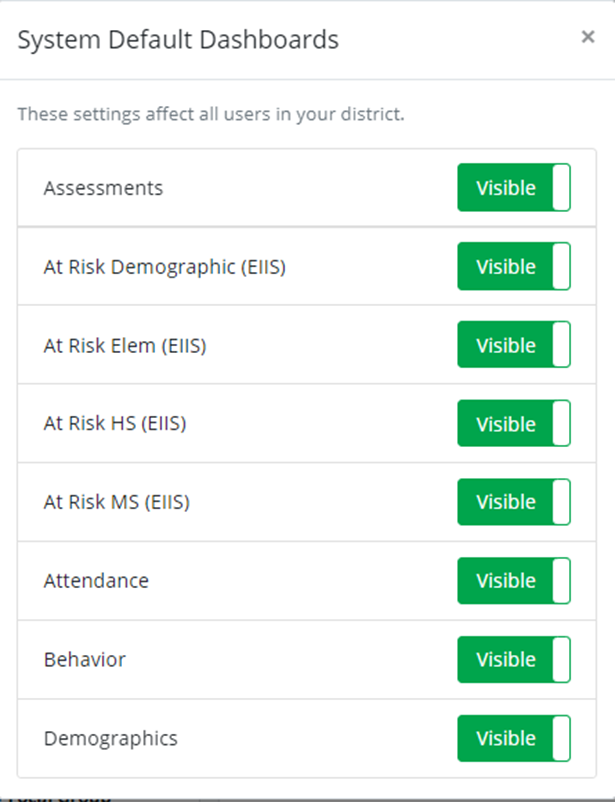
If you select a District Shared page, a text box will appear ‘Warning! This dashboard can be seen by all users in your district,’ making changes to this page will create a change for all users.

Adding or deleting metrics to your page:
-
Adding or deleting metrics:
-
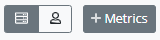
Once you copy or create a new page, the +Metrics box will appear, click on it to make your metric selections.
-
-
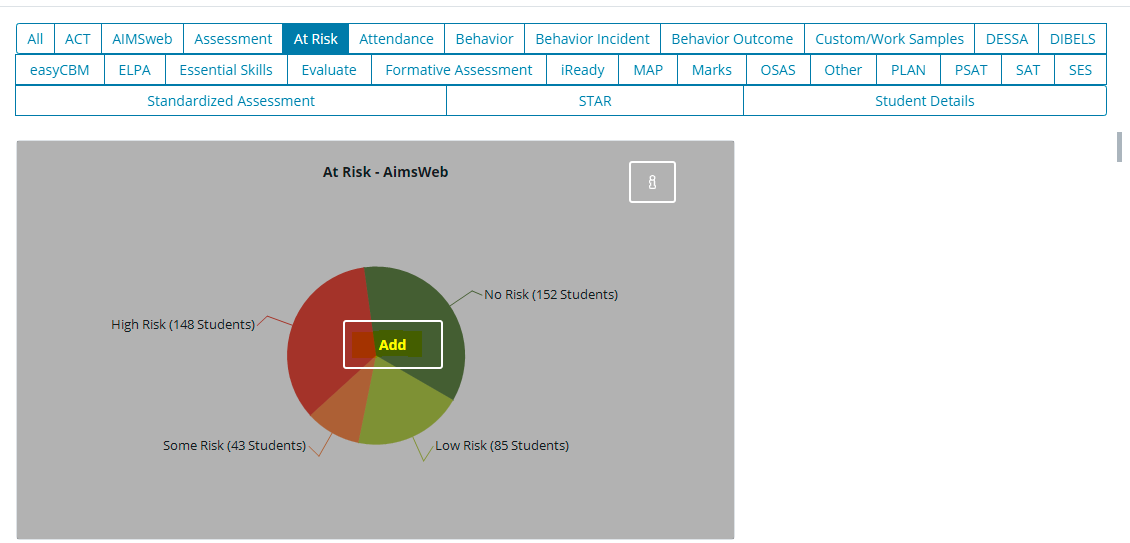
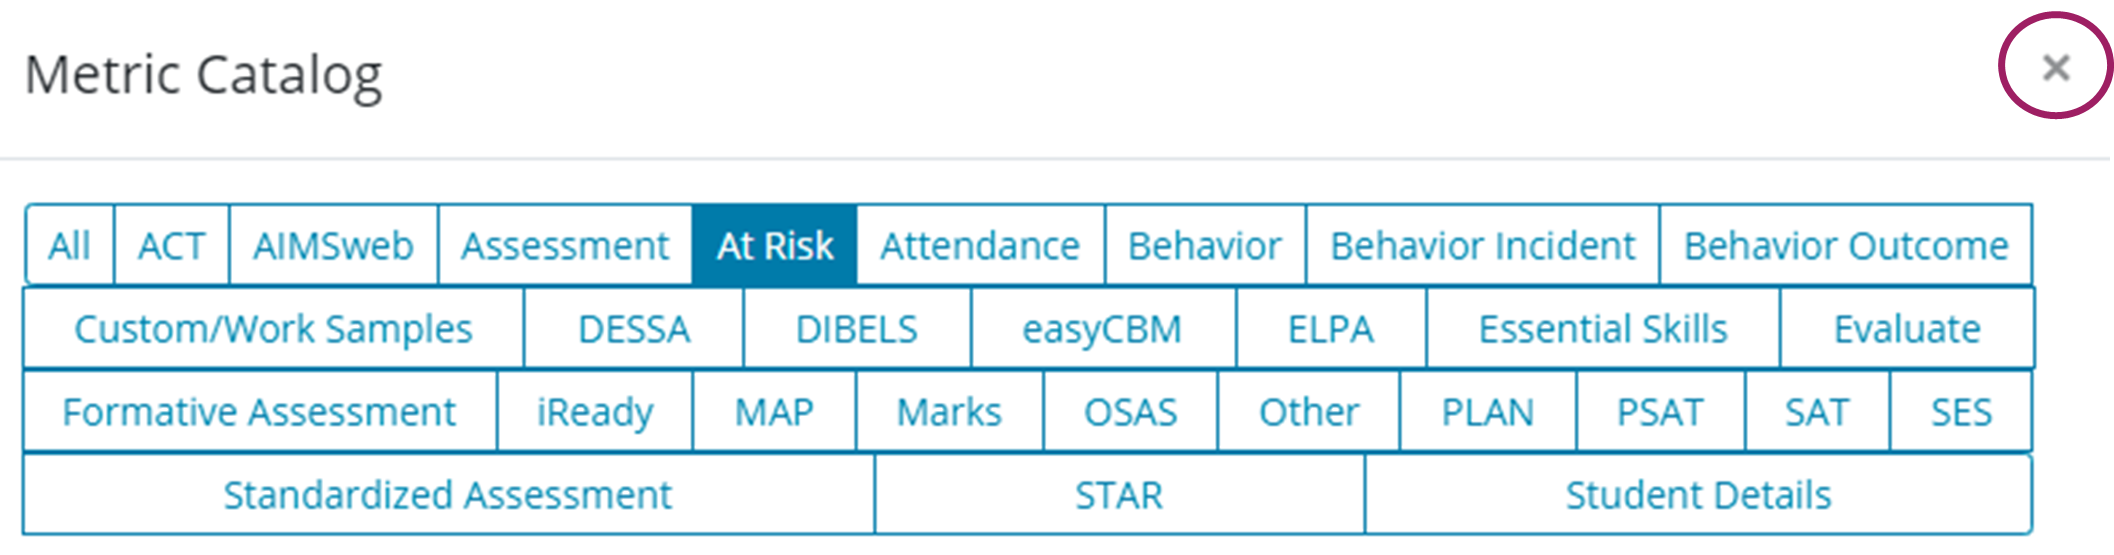
The Metric Catalog has metrics grouped and can be selected from any of the tabs.
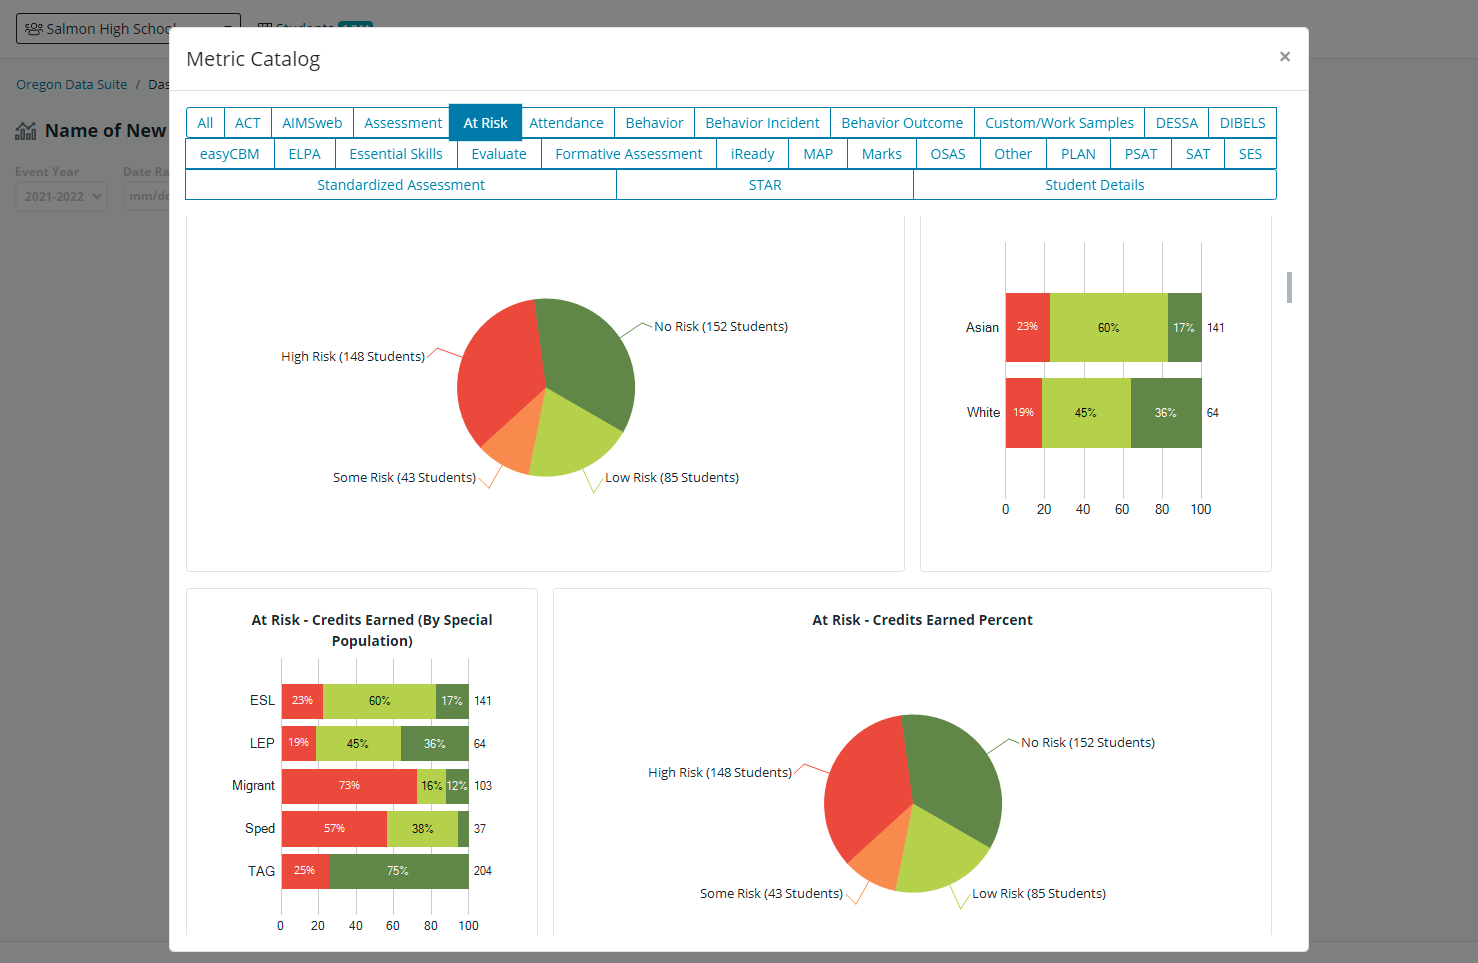
Hover over the metric you would like to add, then click the ‘Add’ button.
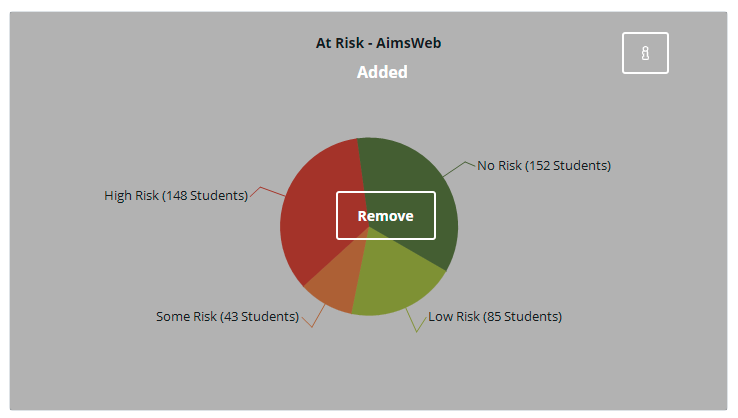
If the metric is already on your page, the graph will be grayed out and the word ‘Added’ will show on the metric. You can remove a metric by hovering over the grayed-out graph and clicking the ‘Remove’ button.
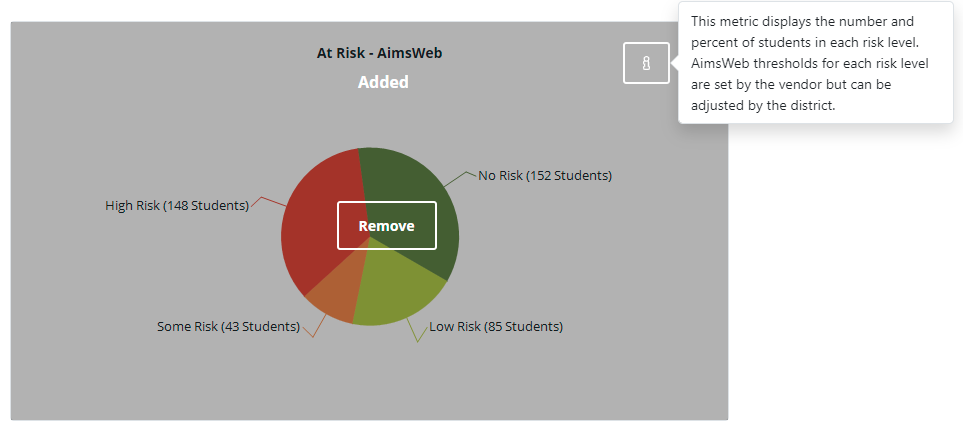
Information about the metric can be seen by clicking the information icon in the upper right-hand corner of the metric.
Click the (x) in the upper left-hand corner to exit the Metric Catalog.
Click ‘Save’ to keep your changes. If you do not want to save your changes, click ‘Cancel’.
-
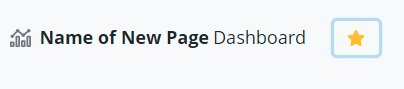
Pages will display alphabetically unless you make your page a favorite, then it will display at the top of your page selection. To make your page a favorite, just click on the star next to the page; it will turn yellow. If you change your mind, click on the star again, and it will no longer be yellow or a favorite.
-
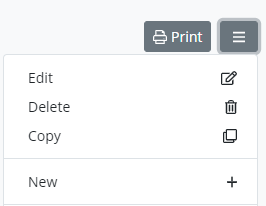
To make a change or delete a page you have created, select the page, click on the Dashboard Menu, and you will now have the option to Edit, Delete, Copy, or add New.