Printing Student Interventions and Student Checkpoints -
|
Pathway: Interventions 
|
Click on an intervention: 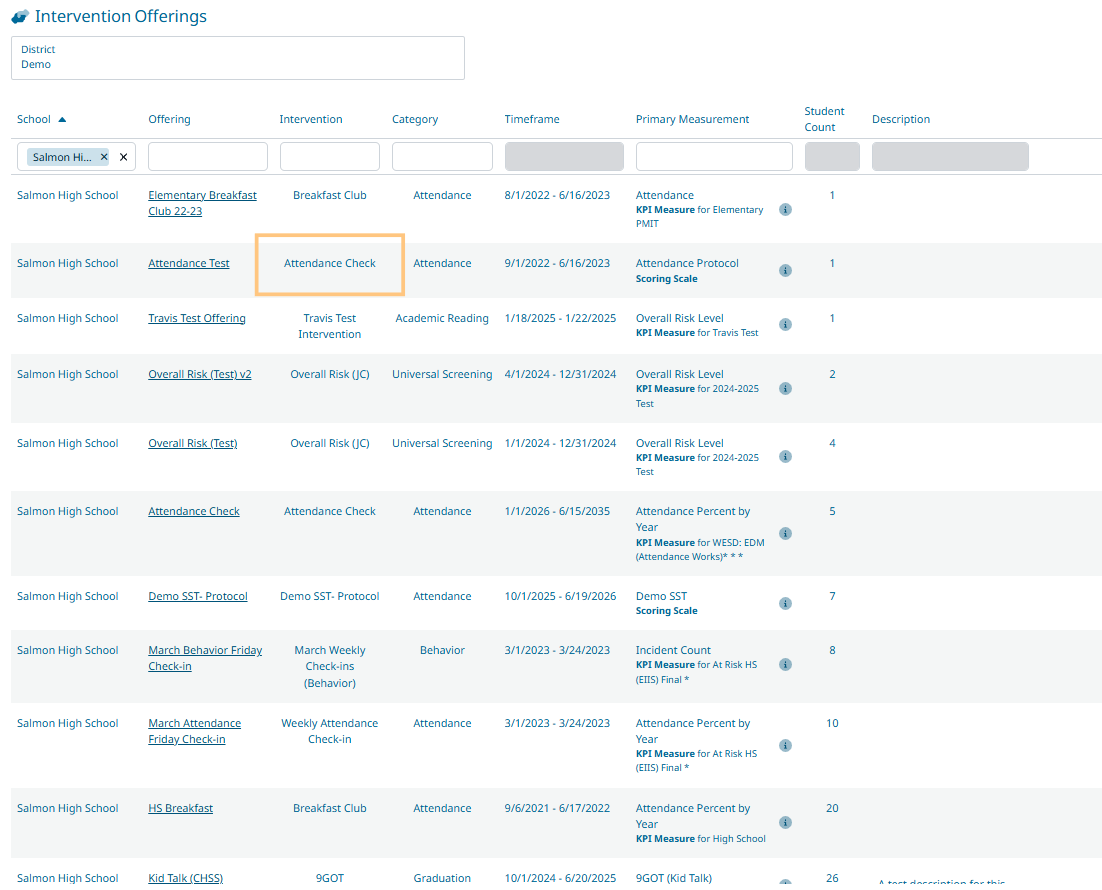
|
|
Click the print button 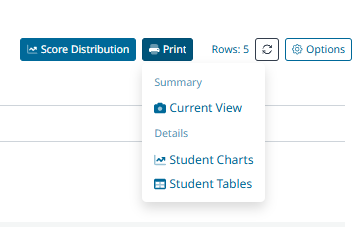
|
|
|
To print a chart for all students, click Student Chart- 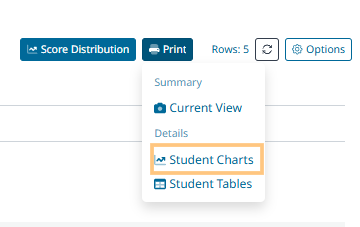
|
To print the table for all students, click Student Tables- 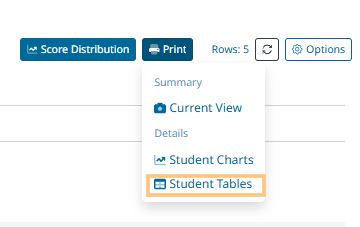
|
Printing individual student interventions:
|
Click on an individual student: 
|
|
|
Click the line view icon to print Line Chart: 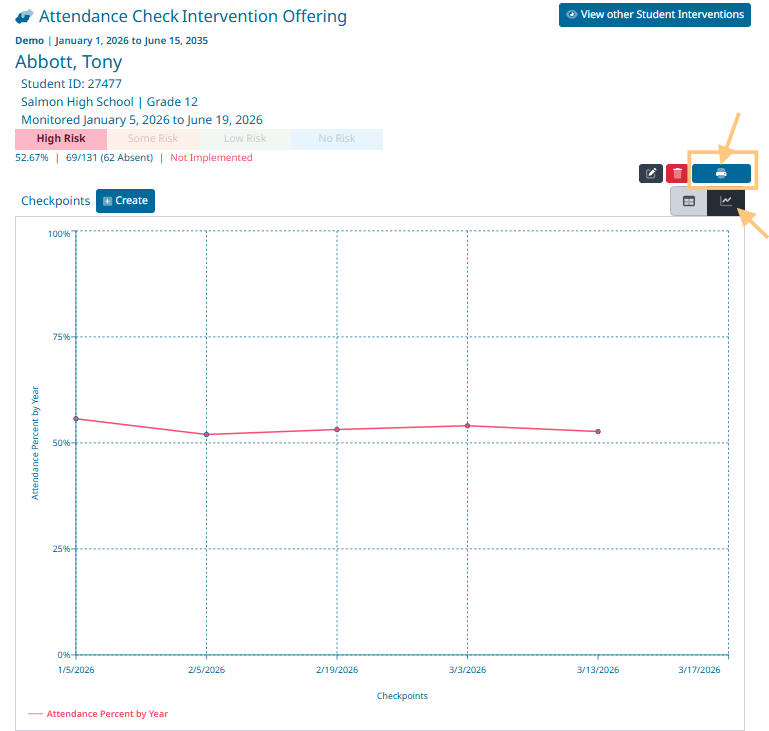
|
Click the table view icon to print Table Graph: 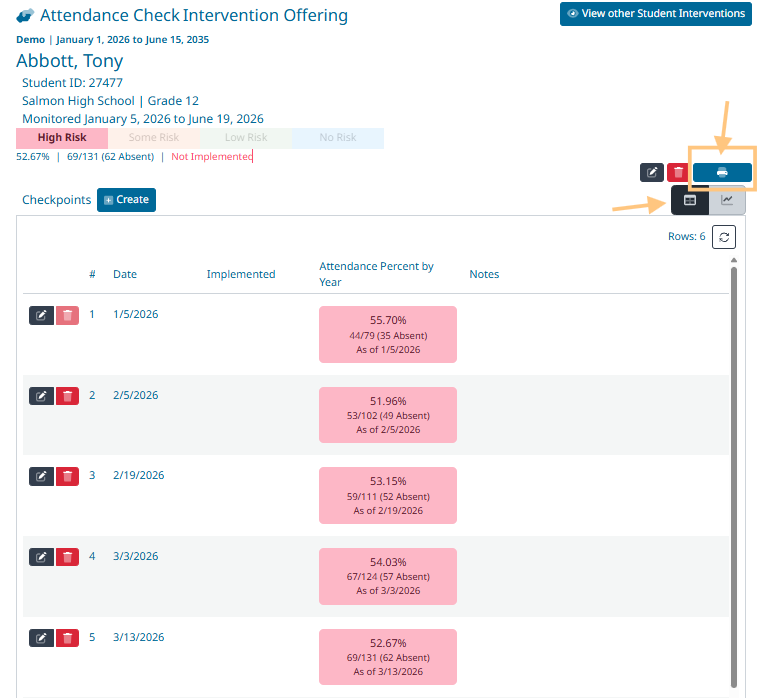
|
|
Click the Printer icon to print the view you’ve selected: 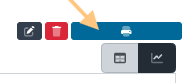
|
|
|
Table Graph View Example 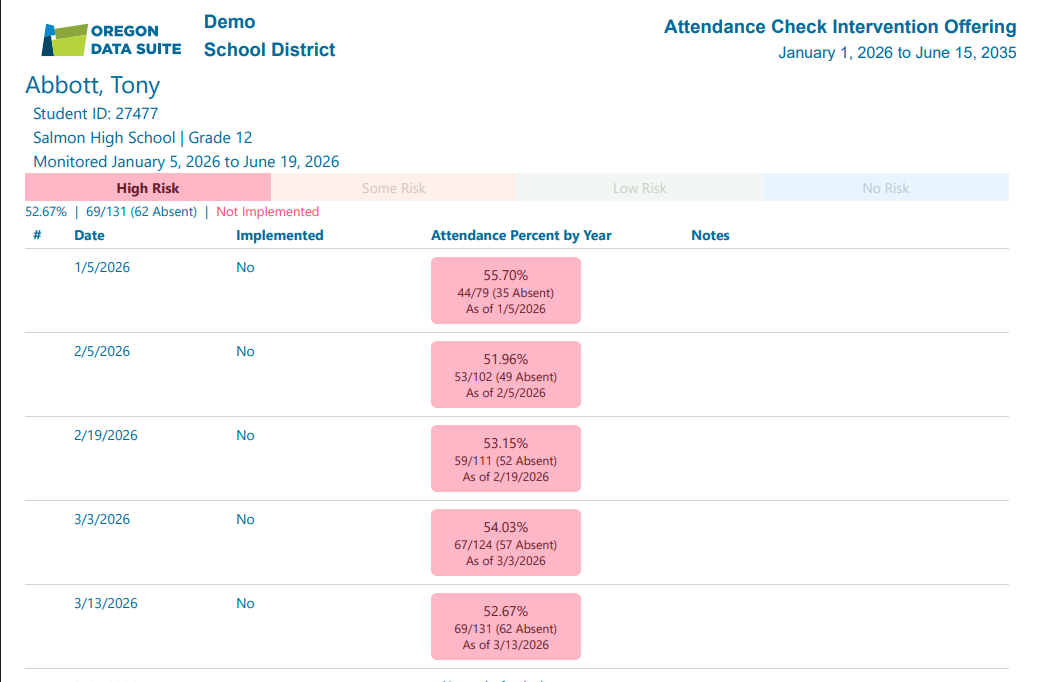
|
|
|
Line Chart View Example 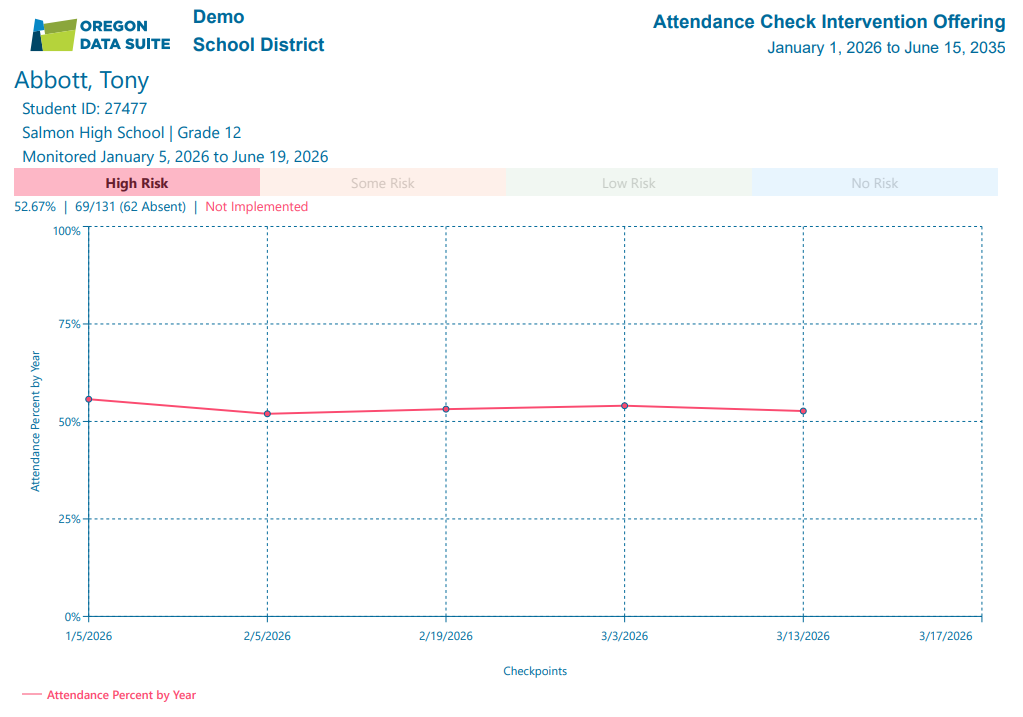
|