“Equity in education is the notion that EACH and EVERY learner will receive the necessary resources they need individually to thrive in Oregon's schools no matter what their national origin, race, gender, sexual orientation, differently-abled, first language, or other distinguishing characteristics.”
-Oregon Education Investment Board: Equity Lens
Below is an example of the type of breakout information you can find for your student populations. This Dashboard page focuses on Attendance, Behavior, & Assessments. Data are disaggregated by race, ethnicity, and focal group.
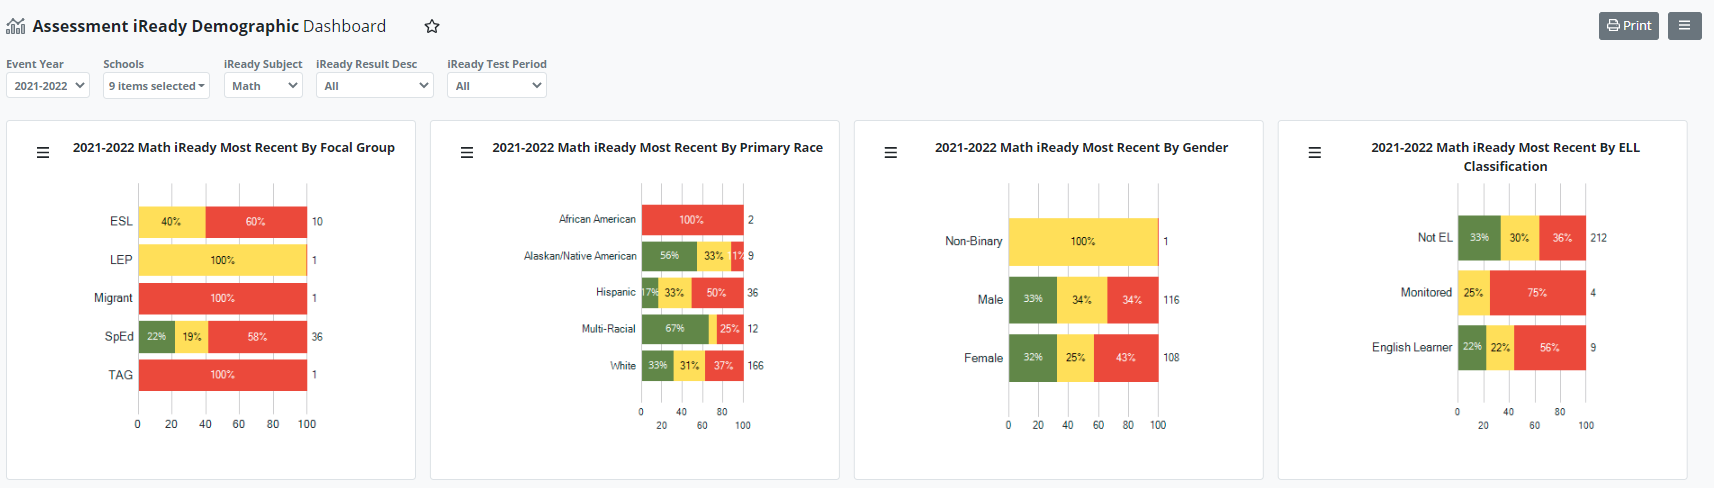
In addition to iReady assessment data, we have metrics available for DIBELS, easyCBM, STAR, ELPA, and OSAS.
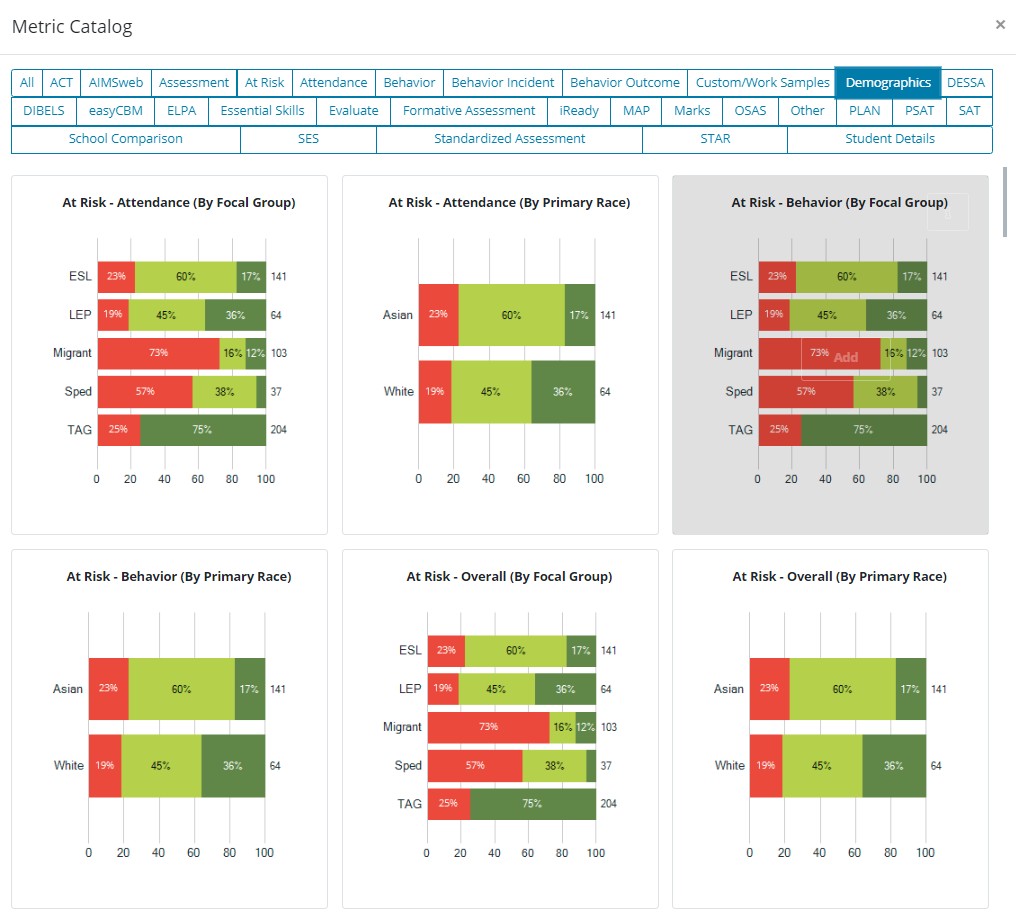
Demographic- Metric Catalog
The Demographics tab in the Metric Catalog has many options to choose from. Keep in mind that any metric can be added to a page. Feel free to mix and match metrics to best create the page that your district will utilize!
Dashboard Customization:
In ODS you can create pages that allow you to pinpoint the main areas of focus in your district. Dashboards can be customized for your entire district or by individual users.
-
Individual User - Customizing Your Dashboard.
-
Admin Level District User - Customizing Dashboards for Your District
Pages can be created and viewed at the district level, school level, grade level, and even at the individual student level. Pages can also be printed. Printing Student Level Pages
Student Filtering:
Filtering is key. Below is an example of how to filter by “Program” to view “Sub-Types” and “Other” to view “Races”. There are too many filtering options to list!